
市场概况:
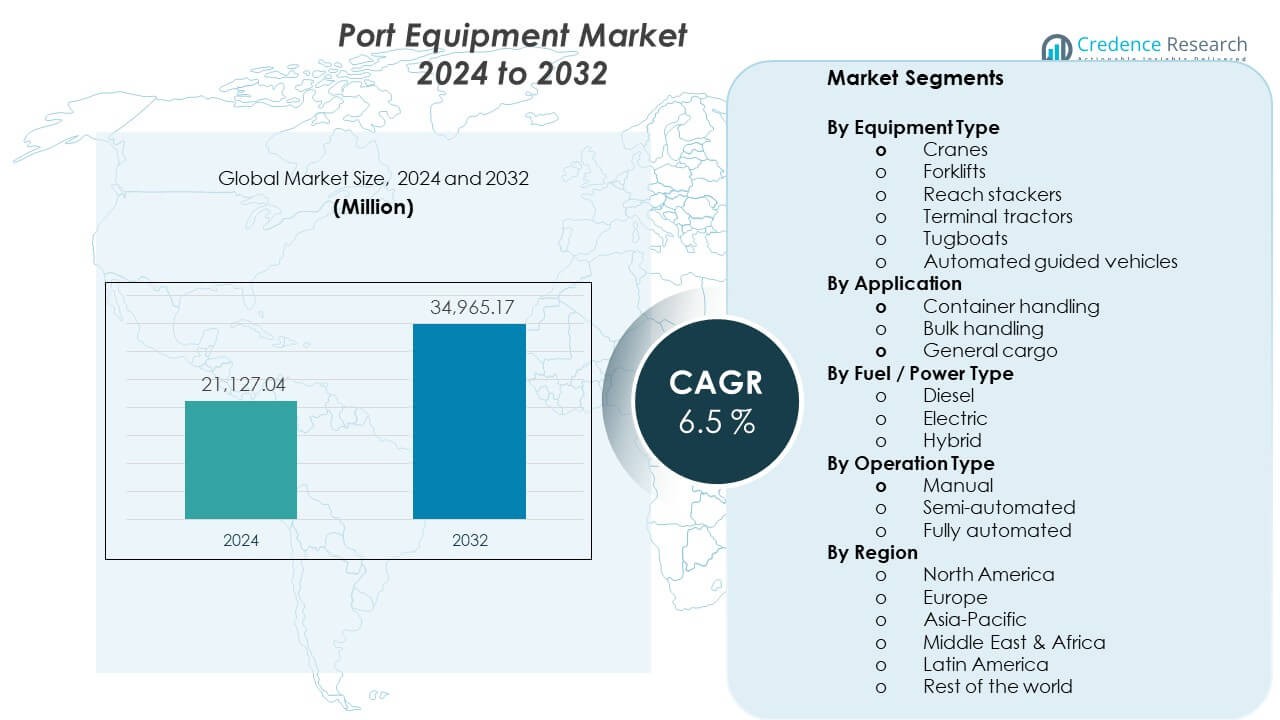
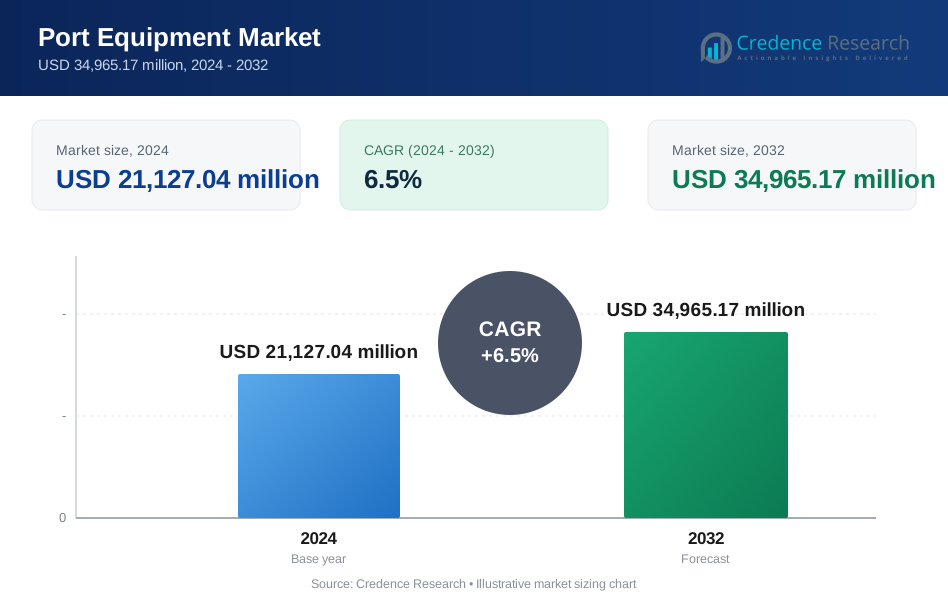
港口设备市场预计将从2024年的211.2704亿美元增长到2032年的349.6517亿美元。预计从2024年到2032年,市场的复合年增长率为6.5%。| 报告属性 | 详细信息 |
|---|---|
| 历史时期 | 2020-2023 |
| 基准年 | 2024 |
| 预测期 | 2025-2032 |
| 2024年港口设备市场规模 | 211.2704亿美元 |
| 港口设备市场,复合年增长率 | 6.5% |
| 2032年港口设备市场规模 | 349.6517亿美元 |
市场洞察:
- 市场在2024年达到211.2704亿美元,到2032年将达到349.6517亿美元,复合年增长率为6.5%。
- 由于大型港口和贸易量,亚太地区以约45%的份额领先,其次是欧洲25%的现代化重点和北美18%的码头升级。
- 中东和非洲是增长最快的地区,份额接近8%,由新港口枢纽、物流走廊和公私投资推动。
- 按应用划分,集装箱处理占据近60%的份额,因高吞吐量需求,而散货处理占约25%,支持商品贸易。
- 按设备类型划分,起重机因重型起重需求占约40%的份额,而场地设备和车辆共同贡献近45%,来自日常码头运营。
市场驱动因素:
全球贸易和集装箱吞吐能力的扩展 海运贸易量的增加推动港口扩大处理能力。 港口设备市场受益于更高的集装箱化货物流量。 港口当局投资于起重机和场地设备以减少拥堵。 更大的船舶需要更高的起重能力和更广的覆盖范围。 码头运营商寻求更快的船舶周转和泊位生产力。 设备升级支持全天候港口运营。 国家物流计划支持大型港口基础设施项目。 这些因素加强了主要港口的设备需求。- 例如,振华重工已交付具有超过24排覆盖范围和65吨以上起重能力的岸桥,支持亚洲主要港口的超大型集装箱船。
- 例如,科尼起重机报告其现代化的轮胎式龙门起重机的可用率超过98%,帮助港口在车队更新计划中提高正常运行时间。
市场趋势:
向自动化和半自动化码头运营的转变 自动化在大型和中型港口中普及。 港口设备市场反映了这一结构性运营转变。 自动化起重机提高了精度和周期一致性。 远程操作增强了工人的安全性和控制。 软件驱动的协调改善了场地交通流量。 码头运营商重视可预测的性能水平。 自动化普及超越了大型港口。 这一趋势重塑了设备规格和设计优先级。- 例如,卡尔玛的AutoStrad™码头拖车系统在自动化集装箱码头展示了超过20小时的连续无人操作,提高了场地生产力的一致性。
- 例如,利勃海尔的电动移动港口起重机实现零本地排放,并提供超过120米/分钟的提升速度,支持可持续性和高吞吐量需求。
市场挑战分析:
高资本投资和长设备回报周期 港口设备需要大量的前期资本支出。 港口设备市场面临买家的预算压力。 长回报期延迟了购买决策。 公共港口依赖政府资金批准。 私人运营商在回报与融资成本之间取得平衡。 经济放缓影响资本分配计划。 货币风险影响进口设备定价。 成本障碍限制了小型港口的采用。 复杂的维护要求和技术工人短缺 先进设备需要技术支持。 港口设备市场面临服务能力差距。 港口难以招聘受过培训的技术人员。 维护延误增加了运营风险。 备件可用性影响正常运行性能。 培训计划需要时间和投资。 设备复杂性增加了服务依赖性。 这些因素挑战了设备的顺利运行。市场机会:
新兴贸易走廊和新码头的港口扩展 新兴经济体在港口容量上投入大量资金。 港口设备市场从绿地项目中受益。 新码头需要全面的设备安装。 贸易走廊的发展支持持续的需求。 公私合作伙伴关系资助大型港口项目。 战略位置吸引物流投资。 早期阶段的港口采用现代设备标准。 扩展项目打开了长期供应机会。 以安全和运营弹性为重点的技术升级 港口优先考虑安全和弹性改进。 港口设备市场从这一重点中受益。 先进的控制系统降低了事故风险。 冗余系统提高了设备可靠性。 耐候设计支持恶劣环境。 安全标准影响采购政策。 弹性设备支持不间断的运营。 这一机会推动了高端设备需求。市场细分分析:
按设备类型 起重机因重型起重和船舶覆盖需求而占据中心地位。 叉车支持码头内灵活的货物移动。 伸缩臂式集装箱堆高机在有限空间内实现快速集装箱堆垛。 码头拖车提高了场地运输效率。 拖船协助船舶操控和港口安全。 自动导引车支持精确和受控的场地流量。- 例如,三一的伸缩臂式集装箱堆高机额定可提升45吨集装箱至五层高,支持高密度集装箱场地处理混合货物量。
细分:
按设备类型- 起重机
- 叉车
- 伸缩臂式集装箱堆高机
- 码头拖车
- 拖船
- 自动导引车
- 集装箱处理
- 散货处理
- 普通货物
- 柴油
- 电动
- 混合动力
- 手动
- 半自动
- 全自动
- 北美
- 美国
- 加拿大
- 墨西哥
- 欧洲
- 德国
- 法国
- 英国
- 意大利
- 西班牙
- 其他欧洲地区
- 亚太地区
- 中国
- 日本
- 印度
- 韩国
- 东南亚
- 其他亚太地区
- 拉丁美洲
- 巴西
- 阿根廷
- 其他拉丁美洲地区
- 中东和非洲
- 海湾合作委员会国家
- 南非
- 其他中东和非洲地区
区域分析:
亚太地区和欧洲市场表现 亚太地区占全球市场的最大份额,接近45%。 港口设备市场受益于中国的大型集装箱量。 日本和韩国通过先进的码头系统支持需求。 东南亚扩展港口容量以支持出口增长。 欧洲占总市场份额的约25%。 德国、荷兰和西班牙因港口现代化而领先。 区域重点仍然是自动化和减排。 北美和中东及非洲市场地位 北美占全球市场份额的约18%。 港口设备市场在美国的码头升级中看到需求。 加拿大支持主要港口的设备更换。 港口专注于提高运营效率和安全标准。 中东和非洲占市场份额的近8%。 海湾国家投资于大规模港口基础设施项目。 非洲港口扩展容量以支持贸易连接。 拉丁美洲和世界其他地区市场展望 拉丁美洲贡献了全球市场份额的近3%。 港口设备市场从出口驱动的港口扩展中获得动力。 巴西和智利引领区域设备需求。 港口投资于农业和矿物货物的处理系统。 世界其他地区占约1%的份额。 小型港口专注于选择性设备更换。 区域需求随着逐步现代化努力而保持稳定。关键玩家分析:
竞争分析:
港口设备市场在全球制造商中显示出强劲的竞争,这些制造商拥有广泛的产品组合。领先的玩家专注于起重机、场地车辆和自动化解决方案,以服务于不同的码头。公司在设备可靠性、生命周期成本和服务覆盖范围上竞争。产品差异化集中在自动化能力和能源效率上。战略合作伙伴关系帮助供应商扩大区域存在。售后服务质量影响买家忠诚度。技术集成加强了竞争定位。规模和制造能力支持价格灵活性。市场保持中度整合,拥有强大的全球品牌。最新发展:
- 2025年9月,利勃海尔集团与南非的Transnet港口码头达成了一项具有里程碑意义的10年战略合作伙伴关系,标志着在非洲港口运营的重大扩展。合作协议于2025年9月18日签署,涵盖了一个全面的20年资产管理计划以及大量设备订单。在此交易下,Transnet已下达了主要订单,包括四台大型岸桥(STS)起重机,用于目前在当地组装的德班港,以及48台轮胎式龙门起重机(RTG),用于德班和开普敦码头,部分设备已投入使用,其他设备的交付也已安排。合作
申请免费样本
填写您的信息,我们将为您发送免费样本报告。
- Sample data tables & charts
- Research methodology
需要本报告的定制版本?
根据您的确切需求定制研究范围、地域或细分市场。
- 定制地域或细分市场范围
- 直接对接我们的分析师团队
常见问题解答
港口设备市场目前的市场规模是多少?预计到2032年将达到多大规模?
港口设备市场预计在2025年至2032年间的复合年增长率是多少?
2024年哪个港口设备市场细分领域占据了最大的份额?
推动港口设备市场增长的主要因素是什么?
港口设备市场的领先公司有哪些?
2024年哪个地区在港口设备市场中占据了最大的份额?
目录
Chapter 1. Report Introduction
- 1.1 Report Description & Purpose
- 1.1.1 Report Title & Market Definition
- 1.1.2 Unique Selling Propositions (USP) & Key Differentiators
- 1.1.3 Value Proposition for Stakeholders
- 1.2 Research Objectives
- 1.2.1 Market Sizing Objectives (Volume & Revenue)
- 1.2.2 Segmentation Objectives
- 1.2.3 Competitive Intelligence Objectives
- 1.2.4 Forecast & Scenario Objectives
- 1.3 Report Scope
- 1.3.1 港口设备市场 Scope – Types & Subtypes Covered
- 1.3.2 Geographic Scope – Regions & Countries Covered
- 1.3.3 Historical Period, Base Year & Forecast Period (2024; forecast to 2032)
- 1.3.4 Inclusions & Exclusions
- 1.4 HS Code & Classification Framework
- 1.5 Currency, Units & Pricing Basis
- 1.6 Target Stakeholders
- 1.7 Limitations & Assumptions
Chapter 2. Executive Summary
- 2.1 Global 港口设备市场 Market Snapshot
- 2.1.1 Market Size – Historical (2024) & Forecast (2024-2032) (2024: USD 21,127.04 million → 2032: USD 34,965.17 million)
- 2.1.2 Volume & Revenue – Global Totals
- 2.1.3 Key Market Highlights – Top Five Facts
- 2.2 港口设备市场 Market Segmentation Snapshot
- 2.2.1 Market Split by Region – 2024 vs. 2032
- 2.3 Competitive Snapshot
- 2.3.1 Top 10 Players by Revenue Share – 2024
- 2.3.2 Top 10 Players by Volume Share – 2024
- 2.3.3 Recent Strategic Developments (18-Month Summary)
- 2.4 Key Investment Highlights & Strategic Conclusions
Chapter 3. 港口设备市场 Market Dynamics & Industry Analysis
- 3.1 Market Overview & Context
- 3.1.1 港口设备市场 Market Position in the Broader Automotive Value Chain
- 3.1.2 OEM vs. Replacement Market Dynamics
- 3.1.3 Market Maturity & Development Stage by Region
- 3.2 港口设备市场 Market Drivers
- 3.3 港口设备市场 Market Restraints & Challenges
- 3.4 港口设备市场 Market Opportunities
- 3.5 Porter's Five Forces Analysis
- 3.5.1 Threat of New Entrants
- 3.5.2 Bargaining Power of Suppliers
- 3.5.3 Bargaining Power of Buyers
- 3.5.4 Threat of Substitutes
- 3.5.5 Competitive Rivalry – Intensity Assessment
- 3.6 港口设备市场 Value Chain Analysis
- 3.6.1 Upstream – Raw Material/Input Suppliers
- 3.6.1.1 Raw Material/Input 1
- 3.6.1.2 Raw Material/Input 2
- 3.6.1.3 Raw Material/Input 3
- 3.6.2 Midstream – Production/Manufacturing/Service Delivery
- 3.6.2.1 Production/Process Overview
- 3.6.2.2 Key Facility Locations & Capacity by Manufacturer
- 3.6.3 Downstream – Distribution & End Consumer
- 3.6.3.1 Primary Channel – B2B/OEM
- 3.6.3.2 Secondary Channels – Dealer, Retail, Online, Direct
- 3.6.4 Value Chain Profitability Analysis
- 3.6.1 Upstream – Raw Material/Input Suppliers
- 3.7 PESTEL Analysis
- 3.7.1 Political Factors
- 3.7.2 Economic Factors
- 3.7.3 Social Factors
- 3.7.4 Technological Factors
- 3.7.5 Environmental Factors
- 3.7.6 Legal Factors
- 3.8 港口设备市场 Supply Chain Analysis
- 3.8.1 Raw Material/Input Supply Risk Assessment
- 3.8.2 Manufacturing Concentration Risk (Geographic Exposure)
- 3.8.3 Trade Disruption Impact Analysis
- 3.9 Regulatory & Policy Landscape
Note: The regulatory and policy landscape section covers regulations based on their applicability to the market, 港口设备市场 category, geography, and scope of the study. Only regulatory frameworks with a material impact on operations, compliance, trade, sustainability, or market access are analyzed in detail.
Chapter 4. Key Investment Pockets & Opportunity Analysis
- 4.1 港口设备市场 Market Attractiveness Analysis
- 4.1.1 By Region – Investment Attractiveness Matrix (Volume × CAGR)
- 4.2 Absolute Revenue Growth Opportunity
- 4.2.1 By Region – Absolute USD Growth Through 2032
- 4.3 Incremental Volume Opportunity
- 4.3.1 By Region – Incremental Volume Through 2032
- 4.3.2 Segment – Incremental Volume
- 4.4 Emerging Submarket Opportunity Deep Dive (Subject to Applicability)
- 4.5 Emerging Market Opportunity Scorecards
- 4.5.1 United States
- 4.5.2 Europe
- 4.5.3 Asia
- 4.5.4 Middle East & Africa
Note: Emerging Market Opportunity Scorecards will be included based on relevance and strategic importance. Regions listed are indicative and may vary depending on data availability and market dynamics.
Chapter 5. 港口设备市场 Import-Export Analysis & Trade Flows
- 5.1 Global Trade Overview
- 5.1.1 Global Export Value by Country (2024)
- 5.1.2 Global Export Volume by Country (2024)
- 5.1.3 Global Import Value by Country (2024)
- 5.1.4 Global Import Volume by Country (2024)
- 5.1.5 Net Trade Balance by Country (2024)
- 5.2 Export Analysis – Segment
- 5.2.1 Type 1 (HS Code)
- 5.2.2 Type 2 (HS Code)
- 5.2.3 Type 3 (HS Code)
- 5.2.4 Type 4 (HS Code)
- 5.2.5 Type 5 (HS Code)
- 5.3 Import Analysis – Segment
- 5.3.1 Type 1 (HS Code)
- 5.3.2 Type 2 (HS Code)
- 5.3.3 Type 3 (HS Code)
- 5.3.4 Type 4 (HS Code)
- 5.3.5 Type 5 (HS Code)
- 5.4 Average Unit Trade Prices
- 5.4.1 Average Export Price – Segment & Country
- 5.4.2 Average Import Price – Segment & Source Country
- 5.4.3 Price Trends (2024)
- 5.5 Key Trade Route Analysis
- 5.5.1 Trade Route 1
- 5.5.2 Trade Route 2
- 5.5.3 Trade Route 3
- 5.5.4 Trade Route 4
- 5.5.5 Trade Route 5
- 5.6 Trade Policy Impact Assessment
- 5.6.1 US Anti-Dumping & Section 301 Tariffs
- 5.6.2 EU Customs Union Impact
- 5.6.3 Major Free Trade Agreements
- 5.6.4 USMCA Rules of Origin
Note: Trade policy analysis will be included only where relevant to the 港口设备市场 market.
Chapter 6. Competitive Landscape & Company Benchmarking
- 6.1 港口设备市场 Market Concentration & Structure
- 6.1.1 Herfindahl-Hirschman Index (HHI) – vs. 2024
- 6.1.2 Tier 1, Tier 2 & Tier 3 Market Structure
- 6.1.3 Global, Regional & Local Player Dynamics
- 6.2 港口设备市场 Market Share Analysis – 2024
- 6.2.1 Global Revenue Share by Company
- 6.2.2 Global Volume Share by Company
- 6.2.3 Regional Revenue Share
- 6.2.4 Market Share Evolution ( vs. 2024)
- 6.2.5 OEM Segment Share by Company
- 6.2.6 Replacement Segment Share by Company
- 6.3 Production/Delivery Capacity & Facility Analysis
- 6.3.1 Global Installed Capacity
- 6.3.2 Capacity Utilization Rates
- 6.3.3 Production/Output Volume
- 6.3.4 Facility Locations & Capacity Map
- 6.3.5 Planned Capacity Additions
- 6.4 港口设备市场 Competitive Benchmarking Matrix
- 6.4.1 Revenue, Volume, CAGR & Profitability Comparison
- 6.4.2 Channel Revenue Mix
- 6.4.3 Geographic Revenue Exposure
- 6.4.4 R&D Intensity
- 6.4.5 Sustainability Maturity
- 6.5 Strategic Developments in 港口设备市场 (Last 24 Months)
- 6.5.1 Mergers, Acquisitions & Divestments
- 6.5.2 New 港口设备市场 Launches
- 6.5.3 Facility Expansions
- 6.5.4 Strategic Alliances, Joint Ventures & Partnerships
- 6.5.5 Distribution Expansion & Market Entry
- 6.5.6 Sustainability & ESG Initiatives
- 6.6 Competitive Strategy Mapping
- 6.6.1 Leader, Challenger, Follower & Niche Classification
- 6.6.2 Pricing Strategy Comparison
- 6.6.3 Channel Strategy Matrix
Note: Strategic developments are included based on their materiality and the availability of reliable information.
Chapter 7. Global 港口设备市场 Market – By Distribution Channel
- 7.1 Segment Overview
- 7.1.1 Volume & Revenue Split by Channel (2024 & 2032)
- 7.1.2 Channel Mix Evolution (2024-2032)
Chapter 8. Regional Market Analysis – Global Overview
- 8.1 Global Regional Overview
- 8.1.1 Regional Volume Share
- 8.1.2 Regional Revenue Share
- 8.1.3 Regional Volume by Region
- 8.1.4 Regional Revenue by Region
- 8.1.5 Regional Forecast Through 2032
- 8.2 Cross-Regional Segment Analysis
- 8.2.1 By Distribution Channel
- 8.2.2 By Brand/Price Tier
Chapter 9. North America 港口设备市场 Market
- 9.1 United States
- 9.2 Canada
- 9.3 Mexico
Chapter 10. Europe 港口设备市场 Market
- 10.1 Germany
- 10.2 France
- 10.3 Italy
- 10.4 United Kingdom
- 10.5 Spain
- 10.6 Poland
- 10.7 Russia
- 10.8 Netherlands
- 10.9 Belgium
- 10.10 Sweden
- 10.11 Denmark
- 10.12 Norway
- 10.13 Rest of Europe
Chapter 11. Asia Pacific 港口设备市场 Market
- 11.1 China
- 11.2 India
- 11.3 Japan
- 11.4 South Korea
- 11.5 Thailand
- 11.6 Indonesia
- 11.7 Vietnam
- 11.8 Malaysia
- 11.9 Australia
- 11.10 Rest of Asia Pacific
Chapter 12. Latin America 港口设备市场 Market
- 12.1 Brazil
- 12.2 Argentina
- 12.3 Colombia
- 12.4 Chile
- 12.5 Rest of Latin America
Chapter 13. Middle East 港口设备市场 Market
- 13.1 Saudi Arabia
- 13.2 United Arab Emirates
- 13.3 Turkey
- 13.4 Israel
- 13.5 Iran
- 13.6 Rest of the Middle East
Chapter 14. Africa 港口设备市场 Market
- 14.1 South Africa
- 14.2 Egypt
- 14.3 Nigeria
- 14.4 Morocco
- 14.5 Rest of Africa
Chapter 15. 港口设备市场 Company Profiles
- 15.1 [Company 01]
- 15.1.1 Company Overview
- 15.1.2 Key Management Personnel
- 15.1.3 Products & Services Portfolio
- 15.1.4 Financial Performance
- 15.1.5 Key Market Focus & Geographic Presence
- 15.1.6 Recent Developments & Strategic Initiatives
Note: The company profile list is preliminary and may change based on research findings, market developments, data availability, and client requirements.
Chapter 16. Appendices
- Appendix A – List of Abbreviations & Acronyms
- Appendix B – Industry Classification Code Reference – Full Series
- Appendix C – Production & Capacity Data Tables
- Appendix D – End-Use & Demand Base Tables
- Appendix E – Consumption & Replacement Rate Assumptions
- Appendix F – ASP Reference Tables
- Appendix G – Manufacturing & Facility Database
- Appendix H – Import-Export Data Tables
- Appendix I – Regulatory Summary Tables
- Appendix J – Primary Research Participant List (Anonymized)
- Appendix K – Primary Research Questionnaire Framework
- Appendix L – Data Sources & Bibliography
- Appendix M – Market Size Divergence & Source Comparison
Chapter 17. Research Methodology
- 17.1 Research Framework & Philosophy
- 17.2 Secondary Research – Sources, Hierarchy & Data Extraction
- 17.3 Data Modeling – Bottom-Up & Top-Down Market Sizing
- 17.4 Primary Research – Stakeholder Framework, LOI & Sample Sizes
- 17.5 Forecast Methodology – Regression, Scenario & Sensitivity Analysis
- 17.6 Quality Control – Four-Layer Validation Framework
- 17.7 Limitations & Standard Assumptions
- 17.8 Disclaimer
